
About the story
Original article
Translated from the original publication. Dates and historical information are retained.
Written for Kunnskapsbanken:
Unemployment is rising, and reduced mobility is hitting local and regional shopping centres in Northern Norway particularly hard.
As expected, NAV’s latest unemployment figures show very high unemployment nationwide. Norway’s unemployment rate is now 10.7 per cent. In Nordland it is 8.5 per cent, while in Troms and Finnmark it is 9.6 per cent.
- Moskenes, at 18.1 per cent, and Gamvik, at 17.3 per cent, have Northern Norway’s highest unemployment rates.
- Eleven municipalities in the region have unemployment above ten per cent, including the large municipalities of Alta (11.4 per cent), Tromsø (10.9 per cent) and Bodø (10.2 per cent).
- Only seven municipalities have unemployment below five per cent: Hattfjelldal (2.9), Dønna (3.1), Rødøy (3.8), Røst (4.2), Hamarøy (4.5), Vega (4.8) and Bardu (4.8).
Table covering all Northern Norwegian municipalities
NAV also publishes figures for unemployment benefit applications received because of temporary layoffs since 9 March this year. The latest industry breakdown was published on 1 April.
Nationally, wholesale and retail trade and repair of motor vehicles account for the largest number of applications. Accommodation and food services, however, clearly rank highest in percentage terms: applications correspond to more than 45 per cent of employees in every county and more than 50 per cent in Northern Norway.
In Troms and Finnmark, NAV has received 2,660 applications because of temporary layoffs in wholesale and retail trade and repair of motor vehicles, and 2,507 in accommodation and food services. Nordland’s corresponding figures are 2,535 and 1,886.
About the figures and applications received
NAV stresses that it is currently counting applications received rather than individual applicants. Nationally, around eight per cent of applications are duplicates: cases where the same person submitted two or more unemployment benefit applications. NAV’s figures therefore slightly exceed the number of people who have applied. One way to estimate individual applicants is as follows. If a municipality has 1,000 applications and duplicates account for eight per cent, the estimated number of individual applicants is 1,000 × 0.92 = 920. The same approach can estimate applications as a proportion of employees. If applications correspond to ten per cent of employees and eight per cent are duplicates, the share of employees who have applied is 10 × 0.92 = 9.2 per cent. Because we do not know the duplicate share in each county or municipality, we use NAV’s unadjusted figures.
Number of unemployment benefit applications in Nordland
Number of unemployment benefit applications in Troms and Finnmark
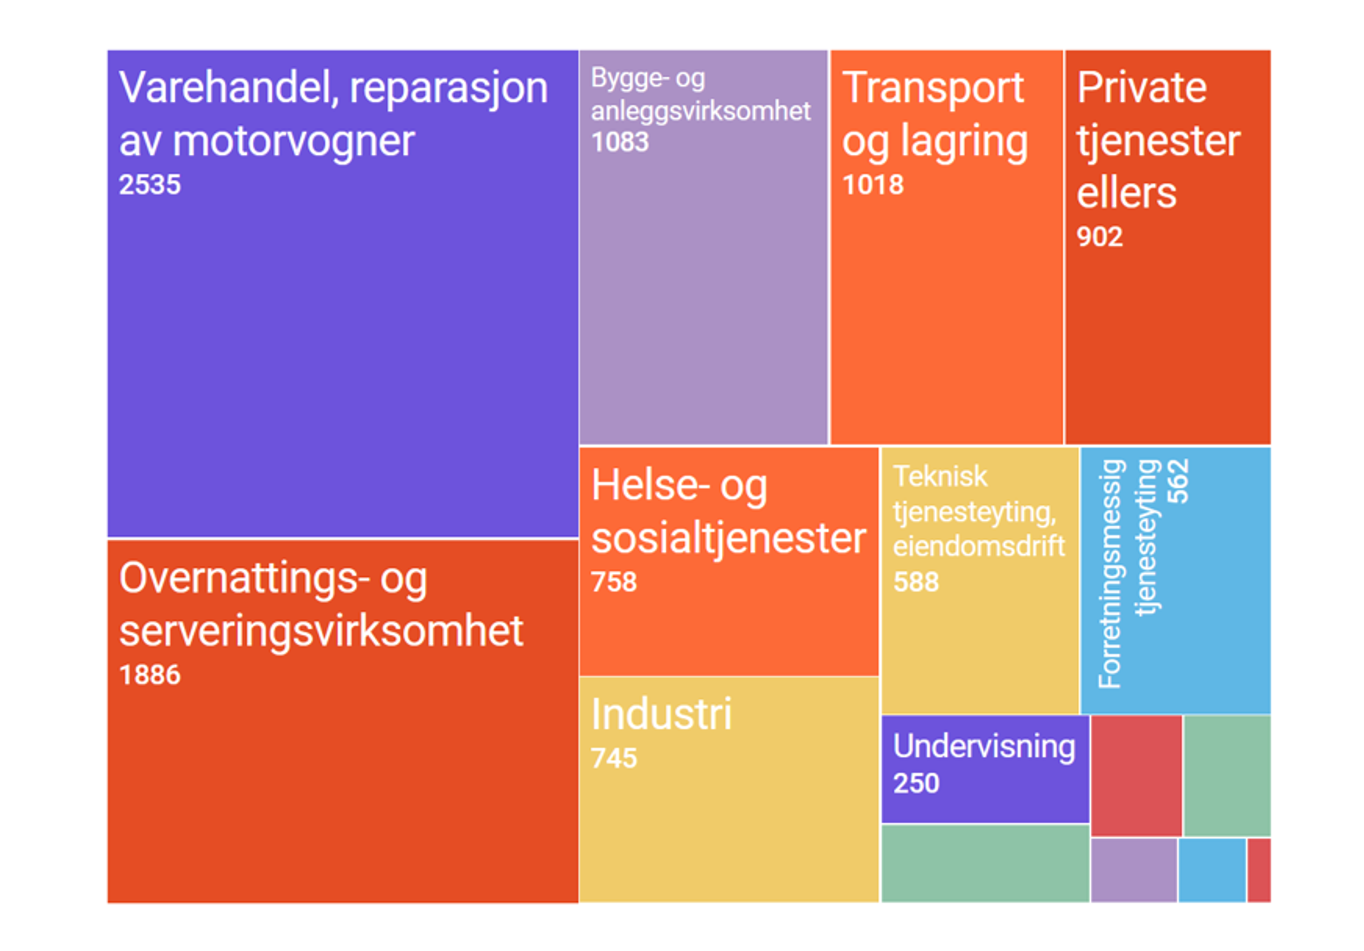
Finally, we examine temporary layoffs in wholesale and retail trade and repair of motor vehicles, Northern Norway’s largest private-sector industry by employment.
Employment in Northern Norway by workplace and industry, 2018. Source: Statistics Norway. Graphics: Kunnskapsbanken.
Regional shopping centres
Some Northern Norwegian municipalities serve as regional shopping centres, attracting customers from several surrounding municipalities. Municipalities such as Sortland, Lenvik, Alstahaug, Alta and Tromsø have significantly higher retail sales per resident—covering groceries and specialist retail—than the national average.
We examine whether these shopping centres have a higher proportion of unemployment benefit applications in retail than other municipalities. The figure below shows all Northern Norwegian municipalities for which data are available.
The horizontal axis shows retail sales per resident for the first half of 2019, the latest period for which we have figures. The vertical axis shows the share of retail employees who have applied for unemployment benefit because of temporary layoffs. Each circle’s size represents the number of applications in that municipality. The straight blue trend line shows the relationship between retail sales per resident and the proportion unemployed in retail.
What is a trend line?
The trend line is calculated using a regression method called weighted least squares. Average sales per resident in each municipality are used to estimate the share of unemployment benefit applications. The line represents the estimated relationship between sales per resident and the application share. To account for substantial differences in application numbers between municipalities, observations are weighted differently in the regression. Municipalities with many applications receive greater weight. For example, Tromsø, which has a very high number of applications, influences the trend line more than a small municipality such as Leirfjord.
Although municipalities vary considerably, those with higher sales per resident tend to have a higher share of applications.
One possible reason is that many people are now avoiding shopping trips to other municipalities and instead shopping locally or online.
This could help explain why municipalities with higher sales per resident also have a higher proportion of temporarily laid-off retail employees.
Sources and references
Historical context
This story is based on an earlier publication. It describes the work and data at that time and is not an updated market report.