
About the story
Original article
Translated from the original publication. Dates and historical information are retained.
For Kunnskapsbanken:
How is value creation developing in Northern Norway? Nordland has the north’s highest total value creation, but recent growth has been lower than in Finnmark and Troms. Finnmark grew more slowly than Nordland and Troms in 2018, but leads in growth over the past ten years. Every Northern Norwegian county has outperformed the rest of Norway in value creation growth over that decade.
Statistics Norway has recently published regional national accounts intended to show value creation in every county. We examine Northern Norway more closely. The region stands out for significantly stronger growth than the rest of the country over the past ten years.
The regional accounts frequently prompt discussion, both about substantial county differences and about methodology: how calculations are made and how precise they are.
Before examining Northern Norway’s figures, we explain some reasons for county differences and why cross-county comparisons do not always make sense. First, however, what is value creation?
Value creation, or gross value added—related to gross domestic product at national level—measures the value generated during a year. Although it provides a somewhat imprecise description of changes in county prosperity and does not capture differences between residents, it is a useful economic indicator. Total value added is distributed among owners receiving operating profits, lenders receiving interest, employees receiving wages and benefits, and authorities receiving taxes and duties.
Not all value created in a region or country necessarily stays there: owners, lenders and employees may be based in other counties or countries.
To calculate county value creation, Statistics Norway allocates mainland Norway’s total value added between counties. Crude oil and natural gas extraction, pipeline transport and international shipping are excluded. For example, value added from oil and gas extraction at Melkøya in Finnmark is excluded, while economic ripple effects from petroleum activities are included in the county figures.
A familiar allocation challenge arises when companies operate branches in several counties. Their value added must be distributed geographically. Statistics Norway has attempted to address this by asking a representative sample to report the share of profits attributable to different branches. The head office responding may overestimate its own contribution to the company’s total value creation.
Value added associated with investment in infrastructure and information systems may also be incorrectly assigned to head offices. Many companies with Northern Norwegian branches have headquarters further south, potentially making actual Northern Norwegian value creation higher than the official figures show. Despite these possible errors, the regional accounts remain the best available source, which we use to examine Northern Norway and the rest of the country.
Inflation-adjusted figures—volume changes—are available only at county and national level. For all of Norway, including crude oil and natural gas extraction, pipeline transport and international shipping, real value added rose 1.3 per cent between 2017 and 2018. Mainland Norway grew 2.2 per cent. Nordland, Troms and Finnmark grew two, 2.5 and 1.8 per cent respectively. This was the third consecutive year in which Troms grew faster than Nordland and Finnmark. Like Statistics Norway, we focus on mainland Norway when comparing the north with the rest of the country.
The region stands out for substantially stronger growth than the rest of Norway over the past ten years.
Svalbard can also be displayed by selecting “Svalbard” below the figure. It has experienced a substantial decline and large annual fluctuations, driven by reduced mining activity.
In nominal terms, at basic prices, Nordland, Troms and Finnmark together generated NOK 220.6 billion in value added in 2018, just over NOK 10 billion, or five per cent, more than the previous year. For mainland Norway excluding Svalbard and the continental shelf, value added was NOK 2,578.7 billion, up 4.2 per cent from 2017. Northern Norway held around 9.2 per cent of the population and 8.5 per cent of mainland value creation in 2018.
Value added per resident was therefore somewhat lower in the north than elsewhere in mainland Norway. Nordland had the highest Northern Norwegian total at NOK 108 billion, followed by Troms at NOK 78 billion and Finnmark at NOK 34.5 billion.
County totals differ substantially. Larger populations and more employment naturally often mean higher total value creation. To simplify comparisons over time, we index value added to 100 in the starting year for every region. A value of 150 in 2018, for example, means growth of 50 per cent since the starting year.
We use nominal figures to compare the Northern Norwegian counties with the rest of Norway. Indexed figures show considerably stronger development in the north over the past decade.
Northern Norwegian value added increased 63 per cent between 2008 and 2018, compared with 49 per cent elsewhere in mainland Norway. Troms and Finnmark performed considerably better than Nordland, but Nordland also outperformed the rest of Norway.
To calculate value added per resident, we use each county’s population at the end of the second quarter of 2018. Troms leads the northern counties at NOK 467,100, followed by Finnmark at NOK 454,400 and Nordland at NOK 444,300. Elsewhere in mainland Norway, the figure was NOK 488,600. The gap has narrowed considerably over the past ten years.
Several factors can explain differences in value added per resident. Demographics are important: counties with a large working-age population, such as Oslo, tend to have more employed people contributing to high value creation per resident. Value added per employed person is therefore a better measure for comparing regional development while accounting for differences in employment.
Value added per employed person has risen substantially both in Northern Norway and elsewhere in mainland Norway.
It has always been higher in the rest of Norway than in the northern counties, but here too the gap has narrowed considerably in recent years. Does this mean Northern Norway creates less value per worker? The answer is not that simple.
Comparing value added per employed person across counties does not give a complete picture. A larger relative public-sector employment share generally lowers measured value creation under Statistics Norway’s method. Public-sector and other non-market value added is measured as the sum of production costs: compensation of employees, net production taxes and depreciation.
Operating surplus is assumed to be zero, so there is no value added beyond those costs. Private-sector calculations include operating surplus—the profit from producing goods and services. Counties with relatively large public sectors therefore tend to have lower calculated value added.
In Northern Norway, 38.9 per cent of employed people worked in public administration in 2018, compared with 29.5 per cent elsewhere in mainland Norway. Troms had the north’s largest share at 40.7 per cent, while Nordland and Finnmark had 37.7 and 39.2 per cent. Given these high shares, lower value added per employed person is unsurprising.
The figure nevertheless shows faster growth per employed person in the north than elsewhere in mainland Norway. Indexed growth makes this even clearer.
Every northern county outperformed the rest of Norway over the past ten years. Value added per employed person grew 49 per cent in Northern Norway, against 37 per cent elsewhere. Finnmark leads decisively, followed by Troms; Nordland also exceeds the rest of Norway. The Finnmark–Troms comparison is interesting: while total value added rose by the same percentage in both counties, growth per employed person was substantially greater in Finnmark.
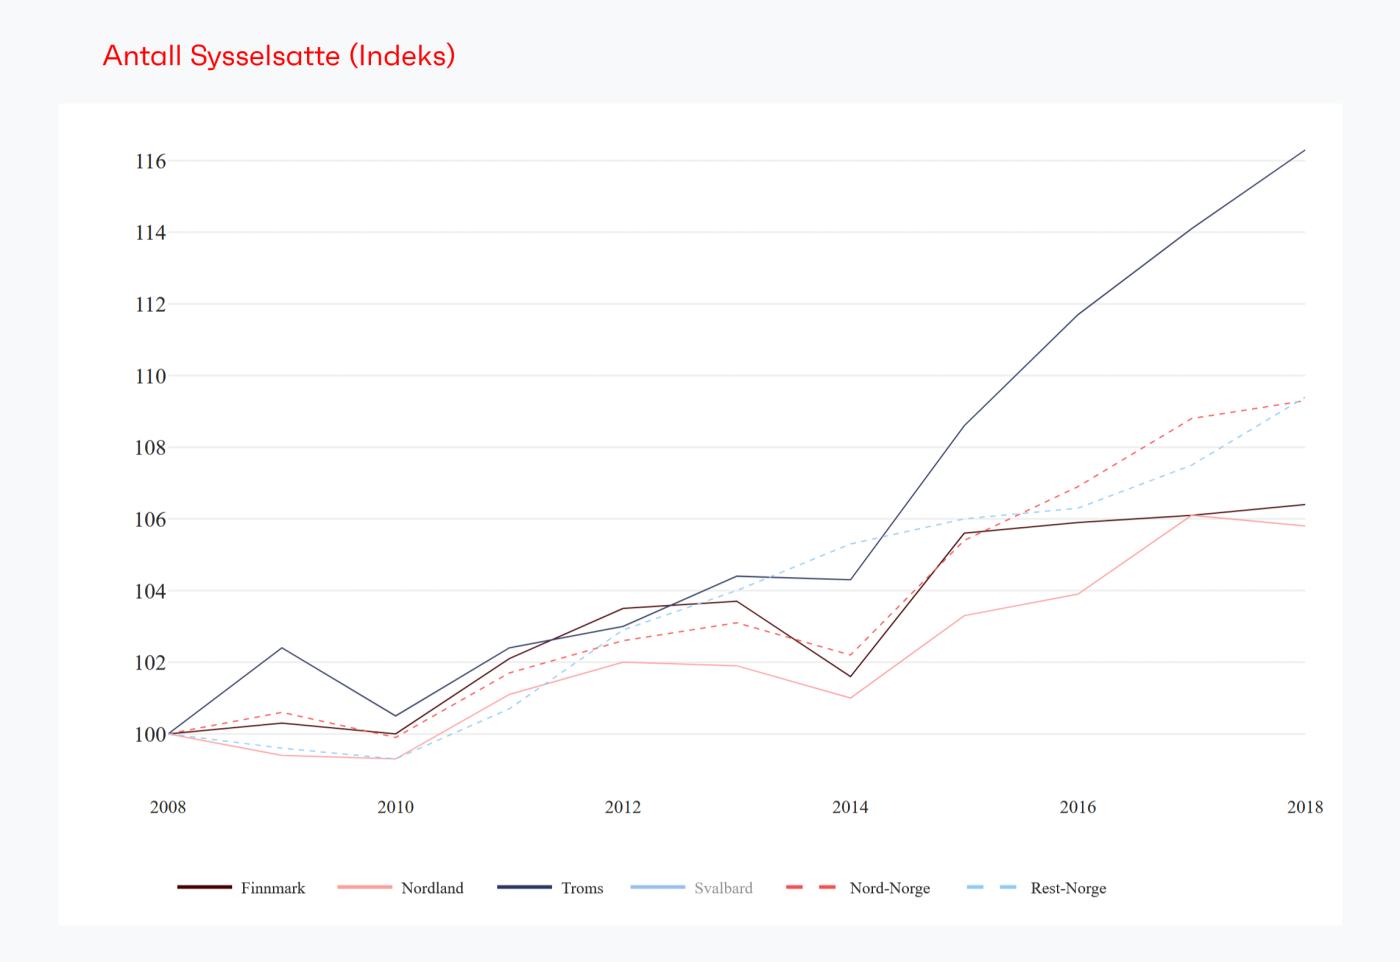
How did this happen? We examine indexed employment growth, also using the regional accounts. Employment grew considerably faster in Troms than in Finnmark or the rest of Norway. Finnmark thus increased total value added as much as Troms with a much smaller rise in employment, producing stronger growth per employed person.
Our review yields several interesting observations. Since 2008, every northern county’s value creation has risen faster than elsewhere in Norway. Finnmark and Troms lead. Employment growth contributed substantially in Troms, whereas Finnmark increased value creation without a corresponding employment increase.
Value added per resident and per employed person remains lower in the north, but has risen faster. What explains this strong growth? Do particular industries stand out positively or negatively? A later article will examine different industries’ contributions.
An important question is whether similar development will continue. The latest Norges Bank Regional Network report shows lower expected output growth over the next six months in Northern Norway than nationally. This need not be worrying: over the past decade, the north’s six-month growth expectations were roughly in line with Norway as a whole. As we have seen, actual value added grew considerably faster in the north.
The Northern Norway Expectations Barometer 2019 shows moderate optimism among businesses and the public sector for the region, with revenue, volume and employment all expected to rise over the coming 12 months. Could Northern Norway soon exceed the national average for value creation?
Sources and references
- ssb.no — reference (source in Norwegian)
- ssb.no — reference (source in Norwegian)
- ssb.no — reference (source in Norwegian)
- ssb.no — reference (source in Norwegian)
- telleren.kbnn.no — reference (source in Norwegian)
- ssb.no — reference (source in Norwegian)
- norges-bank.no — reference (source in Norwegian)
- kbnn.no — reference (source in Norwegian)
Historical context
This story is based on an earlier publication. It describes the work and data at that time and is not an updated market report.