
About the story
Original article
Translated from the original publication. Dates and historical information are retained.
For Kunnskapsbanken:
Salmon prices have doubled since 2012, from NOK 32 per kilogram in inflation-adjusted terms to around NOK 63 in the first three months of 2019, according to Statistics Norway. The reasons are complex. We have analysed export volume, exchange rates and demand growth to assess their contributions to salmon price increases over the past eight years.
As in any market, increased production tends to lower prices, while increased demand raises them. Almost all Norwegian salmon is exported, making exchange rates particularly important for domestic price formation. A weaker krone raises prices measured in Norwegian kroner.
Norwegian trade statistics show fresh salmon export volumes were just under six per cent higher in 2018 than in 2012. Over the same period, the krone weakened more than 20 per cent against the euro, the currency in Norway’s largest salmon markets. Measuring demand changes in euros, we estimate total demand growth of 66 per cent from 2012 to 2018.
We explain how demand growth can be calculated and discuss its causes.
Background
We then examine how production volume, currencies and demand affected salmon prices from 2012 to 2018, before considering how 2019 might develop.
How can demand changes be calculated?
We examine annual changes in prices and volumes since 2012. For most, if not all, consumers, a higher price means buying less. Similarly, producers must reduce prices to sell more.
Salmon production must be planned well before fish are ready for harvest. Licences, regulation and access to suitable sites restrict production expansion, both in Norway and worldwide. Given recent high prices, producers are operating at available capacity. Slightly higher or lower prices have little effect on short-term output.
Other factors can also matter. Sea temperatures, efficiency improvements, mortality and regulation affect annual production.
If Norwegian salmon output and exports increase, prices must fall to persuade consumers to buy more—unless demand also increases. When both export volumes and prices rise, demand must have grown. Demand growth is essential to selling more without lower prices.
How can that growth be quantified? We need an idea of the demand curve: the relationship between prices and quantities consumers want, and what they are willing to pay for different quantities. Here we examine Norwegian salmon demand and how changes in output affect willingness to pay.
Lower volume allows a higher price, while higher volume requires lower prices.
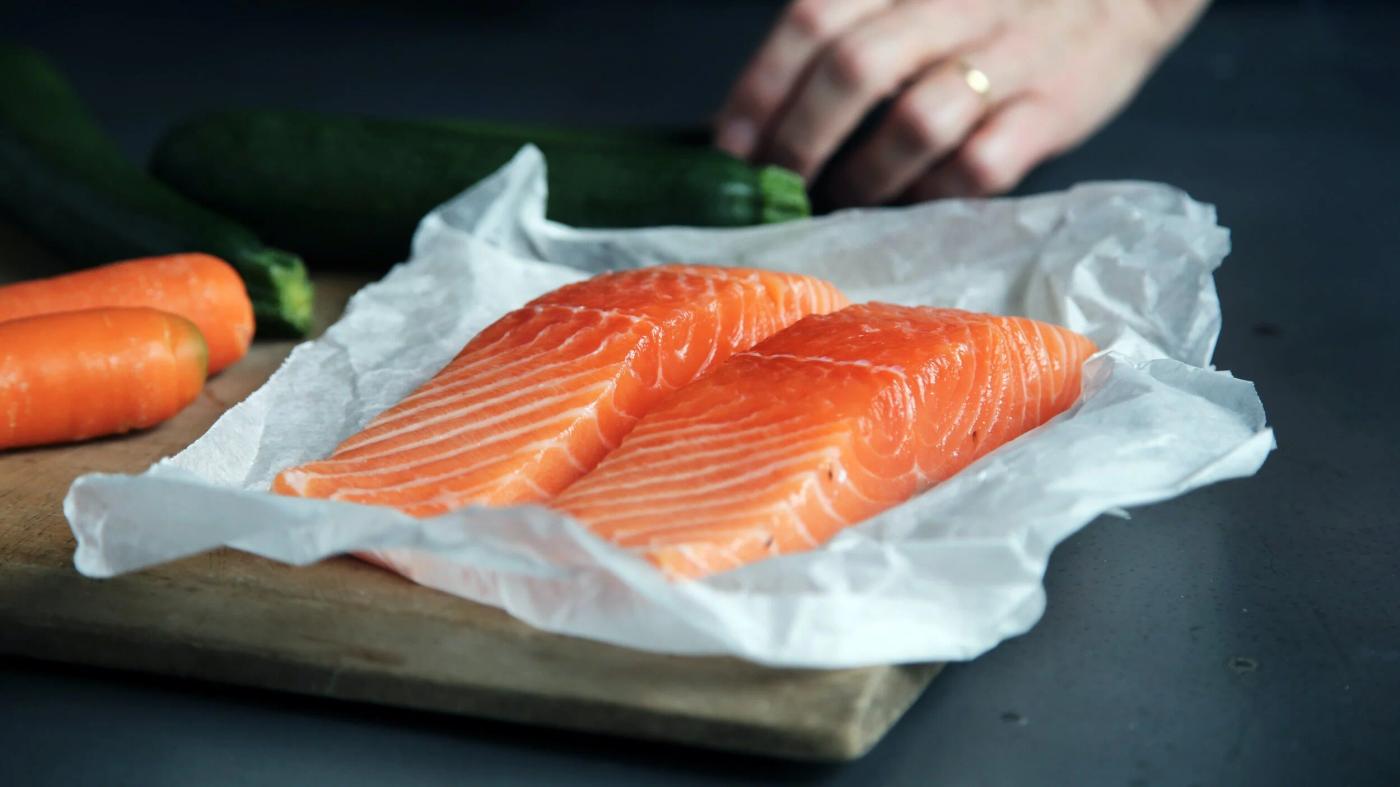
Photo: Susanne Hætta for Kunnskapsbanken. The relationship between quantity and price on the demand side is commonly called price elasticity of demand.
It measures the percentage reduction in quantity demanded following a one per cent price rise. If elasticity were zero, consumers would buy the same amount regardless of price. Norwegian salmon producers are not that fortunate.
Our analysis estimates Norwegian salmon demand elasticity at around −1.1. A ten per cent price rise therefore reduces quantity demanded by 11 per cent; a ten per cent price fall increases it by 11 per cent.
Observed price and quantity changes can then be used to calculate annual demand changes. Between 2012 and 2013, for example, salmon prices in euros rose around 35 per cent while volumes fell around four per cent.
With unchanged demand, that price rise would have implied a fall in quantity demanded of around 38 per cent.
Alternatively, we can start with export volume changes and calculate willingness to pay for the exported quantity.
With unchanged demand, a four per cent export decline would have implied a price rise of 3.6 per cent. The actual 35 per cent rise therefore indicates increased demand in 2013.
Demand growth caused prices to rise much more than they otherwise would have.
Using this approach for every year from 2012 to 2018, we estimate cumulative demand growth of 66 per cent.
Demand for salmon increased 66 per cent from 2012 to 2018
Photo: Susanne Hætta for Kunnskapsbanken.
Why has salmon demand increased?
The causes are complex. Income growth encourages greater consumption, while higher prices for alternatives shift consumption towards salmon. These factors explain far from everything, however.
Several other factors have contributed. Distribution development and new products have been, and will remain, important drivers. Salmon in ready meals, cheese, pizza, pies, baby food, pet food and salmon “bacon” are examples that introduce salmon to new consumers.
Salmon reaches new consumers through ready meals, cheese, pizza, pies, baby food, pet food and salmon “bacon”
More retail chains worldwide make salmon accessible to more consumers. Better logistics from harvest through processing to consumers reduce mark-ups between farm and shop, benefiting producers through higher demand for fresh salmon as a raw material.
Unlike wild-caught fish, salmon producers and customers know reasonably far ahead how much will be available. Every part of the value chain can plan purchasing, processing labour and promotions knowing supply is available. This further reduces costs between farm and plate.
Causes of price changes
Demand growth of 66 per cent means Norway could have exported 66 per cent more salmon in 2018 than in 2012 at the same euro price. Actual export growth was just under six per cent, and the krone weakened considerably, so prices in 2018 were substantially higher.
Comparing supply growth, demand growth and currency effects shows demand was the main driver. Demand growth contributed a 70 per cent price increase; the weaker krone contributed 28 per cent; production growth reduced prices by seven per cent. Together, these imply a 92 per cent price increase from 2012 to 2018. The figure below shows currency, export volume and demand effects since 2012.
What can we learn?
Strong demand growth has been the main driver of salmon prices. Continued historical demand growth would be favourable for those seeking high prices. Producers have also benefited from a weak krone. A return to its 2012 exchange-rate level would substantially reduce prices measured in Norwegian kroner.
This analysis does not explain everything. Measured demand growth for Norwegian salmon depends on access to salmon from other countries. Increased foreign production makes consumers less dependent on Norwegian supply and weakens demand growth, potentially making it negative. Other currencies also matter: as a consumer market grows, its exchange rate against the krone has a greater influence on Norwegian salmon prices. Including other currencies would improve the picture.
As in all markets, greater production lowers prices. If production continues growing slowly, demand continues outpacing it, and exchange rates avoid a shock, prices will keep rising. This could make new production methods, including land-based farming, profitable despite considerably higher costs than conventional farming.
Accounting for other currencies would improve our understanding of currency effects on Norwegian salmon prices.
What happens next in 2019?
The analysis can also be used prospectively. Assumptions about currencies, production and demand can produce a future price forecast. Those assumptions are highly uncertain. Demand growth has not been smooth: large jumps in 2013 and 2016 were followed by smaller changes. Will 2019 bring another jump, a pause, or declining demand?
Allowing for uncertainty in assumptions makes it possible to estimate probabilities for price intervals around a future price. Assuming exchange rates remain at their year-to-date level, Norwegian production and exports rise five per cent, and demand grows at its average annual rate since 2012, the forecast 2019 price is around NOK 63 per kilogram. Norwegian salmon may be heading for another record year.
## References
Asche F, Bjørndal T (2011) The Economics of Salmon Aquaculture, 2nd edn. Wiley-Blackwell, London Asheim LJ, Dahl RE, Kumbhakar SC, et al (2011) Are Prices or Biology Driving the Short-Term Supply of Farmed Salmon? Mar Resour Econ 4:343–357 Brækkan EH (2014a) Why do Prices Change? An Analysis of Supply and Demand Shifts and Price Impacts in the Farmed Salmon Market. Doktoravhandling, UiT - Norges Arktiske Universitet Brækkan EH (2014b) Disentangling supply and demand shifts: the impacts on world salmon price. Appl Econ 46:3942–3953 Brækkan EH, Thyholdt SB (2014) The Bumpy Road of Demand Growth—An Application to Atlantic Salmon. Mar Resour Econ 29:339–350 Brækkan EH, Thyholdt SB, Asche F, Myrland Ø (2018) The demands they are a-changin’. Eur Rev Agric Econ 45:531–552 Chidmi B, Hanson T, Nguyen G (2012) Substitutions between Fish and Seafood Products at the US National Retail Level. Mar Resour Econ 27:359–370 Davis C, Lin B-H, Yen S (2007) Consumer demand for meat cuts and seafood. In: American Agricultural Economics Association. 2007 Annual Meeting, 29 July–1 August, Portland, OR Fousekis P, Revell B (2004) Retail fish demand in great britain and its fisheries management implications. Mar Resour Econ 19:495–510 Hong TTK, Duc NM (2009) Competition Between Us Catfish And Imported Fish: A Demand System Analysis. J Agric Sci Technol 2009:111–118 Jones K, Wozniak S, Walters L (2013) Did the Proposed Country-of-Origin Law Affect Product Choices? The Case of Salmon. J Food Prod Mark 19:62–76 Sakai Y, Yagi N, Ariji M, et al (2009) Substitute and complement relations among various fish species in the Japanese market: implications for fishery resource management. Fish Sci 75:1079–1087. doi: 10.1007/s12562-009-0140-y Xie J, Kinnucan HW, Myrland Ø (2009) Demand elasticities for farmed salmon in world trade. Eur Rev Agric Econ 36:425–445 Xie J, Myrland Ø (2011) Consistent Aggregation in Fish Demand: A Study of French Salmon Demand. Mar Resour Econ 26:267–280
Historical context
This story is based on an earlier publication. It describes the work and data at that time and is not an updated market report.